Table of Content
TLDR;
While Open Lakehouse platforms now natively support tables, geospatial data, vectors, and more, property graphs are still missing. In the age of AI and growing interest in Graph RAG, graphs are becoming especially relevant – there’s a need to deliver Knowledge Graphs to RAG systems, with standards, ETL, and frameworks for different scenarios. There’s a young project, Apache GraphAr (incubating), that aims to define a storage standard. For processing, there is a good tooling already. GraphFrames is like Spark for Iceberg – batch and scalable on distributed clusters; Kuzu is like DuckDB for Iceberg – fast, in-memory, and in-process; Apache HugeGraph is like ClickHouse or Doris for graphs – a standalone server for queries. I’m currently working also on graphframes-rs to bring Apache DataFusion and its ecosystem into this picture. All the pieces seem to be here – it just remains to put them together.
Introduction
Open Lakehouse
This isn’t an official definition – just my personal view of the Open Lakehouse concept. Open Lakehouse is an approach where data lives in shared storage accessible to many systems. The storage can be cloud-based, like Amazon S3 or Azure Blob Storage. It can also be on-premises, such as HDFS, Ceph, or MinIO. There are even solutions aimed at building hybrid cloud + on-prem setups, like IOMETE.
Different data types use their own open storage standards. For tabular data, there’s Apache Iceberg, Delta Lake, and Apache Hudi. For vectors, Lance can be used. For geospatial data, GeoParquet is one option. Metadata about tables and datasets is kept in a central catalog, like Unity Catalog or Hive Metastore. This allows tools and engines discover where data lives and how it’s structured.
Different systems are used for different tasks. Apache Spark is great for distributed batch processing of terabytes of data – it’s not the fastest, but it’s reliable and fault-tolerant. DuckDB is a strong choice for fast, in-memory analytics and is also excellent for single-node ETL tasks. For example, if you have both huge tables (a good case for Spark) and small ones (where spinning up a cluster is overkill), DuckDB is very efficient. Apache Doris and ClickHouse are super solutions for data analysts who need to interactively pull insights from large datasets. For streaming tables and real-time processing, Apache Flink with Apache Paimon is a good fit – for example, when you need to replicate data from a production PostgreSQL database using Debezium.
All these tools interact with the catalog. They locate, read, process, and write data in standard formats. The catalog also helps with governance and access management, keeping metadata up to date and ensuring everything works together smoothly.
This concept makes it possible to seamlessly connect different tools, always choosing the best one for the job. You don’t have to spin up a cluster just to process a 100 MB table, or rent massive single-node instances (with limited capacity) to crunch terabytes of data by a tool designed for single-node processing. There’s no need to force vector search into pure SQL, either. The Open Lakehouse approach lets you mix and match systems, using each where it fits best, and keeps everything interoperable and efficient.
Property Graphs
This isn’t a textbook definition – just how I personally see the concept of a property graph. At its core, a graph is a set of vertices (nodes) and edges (links) connecting them. Edges can be directed or undirected. They can also be weighted or unweighted. Both vertices and edges can have their own properties – key-value pairs with extra information. In practice, we often have different types of vertices and edges, each with their own set of properties.
This leads us to the Property Graph model – a graph that contains multiple types of vertices and edges, each of which may have different properties.
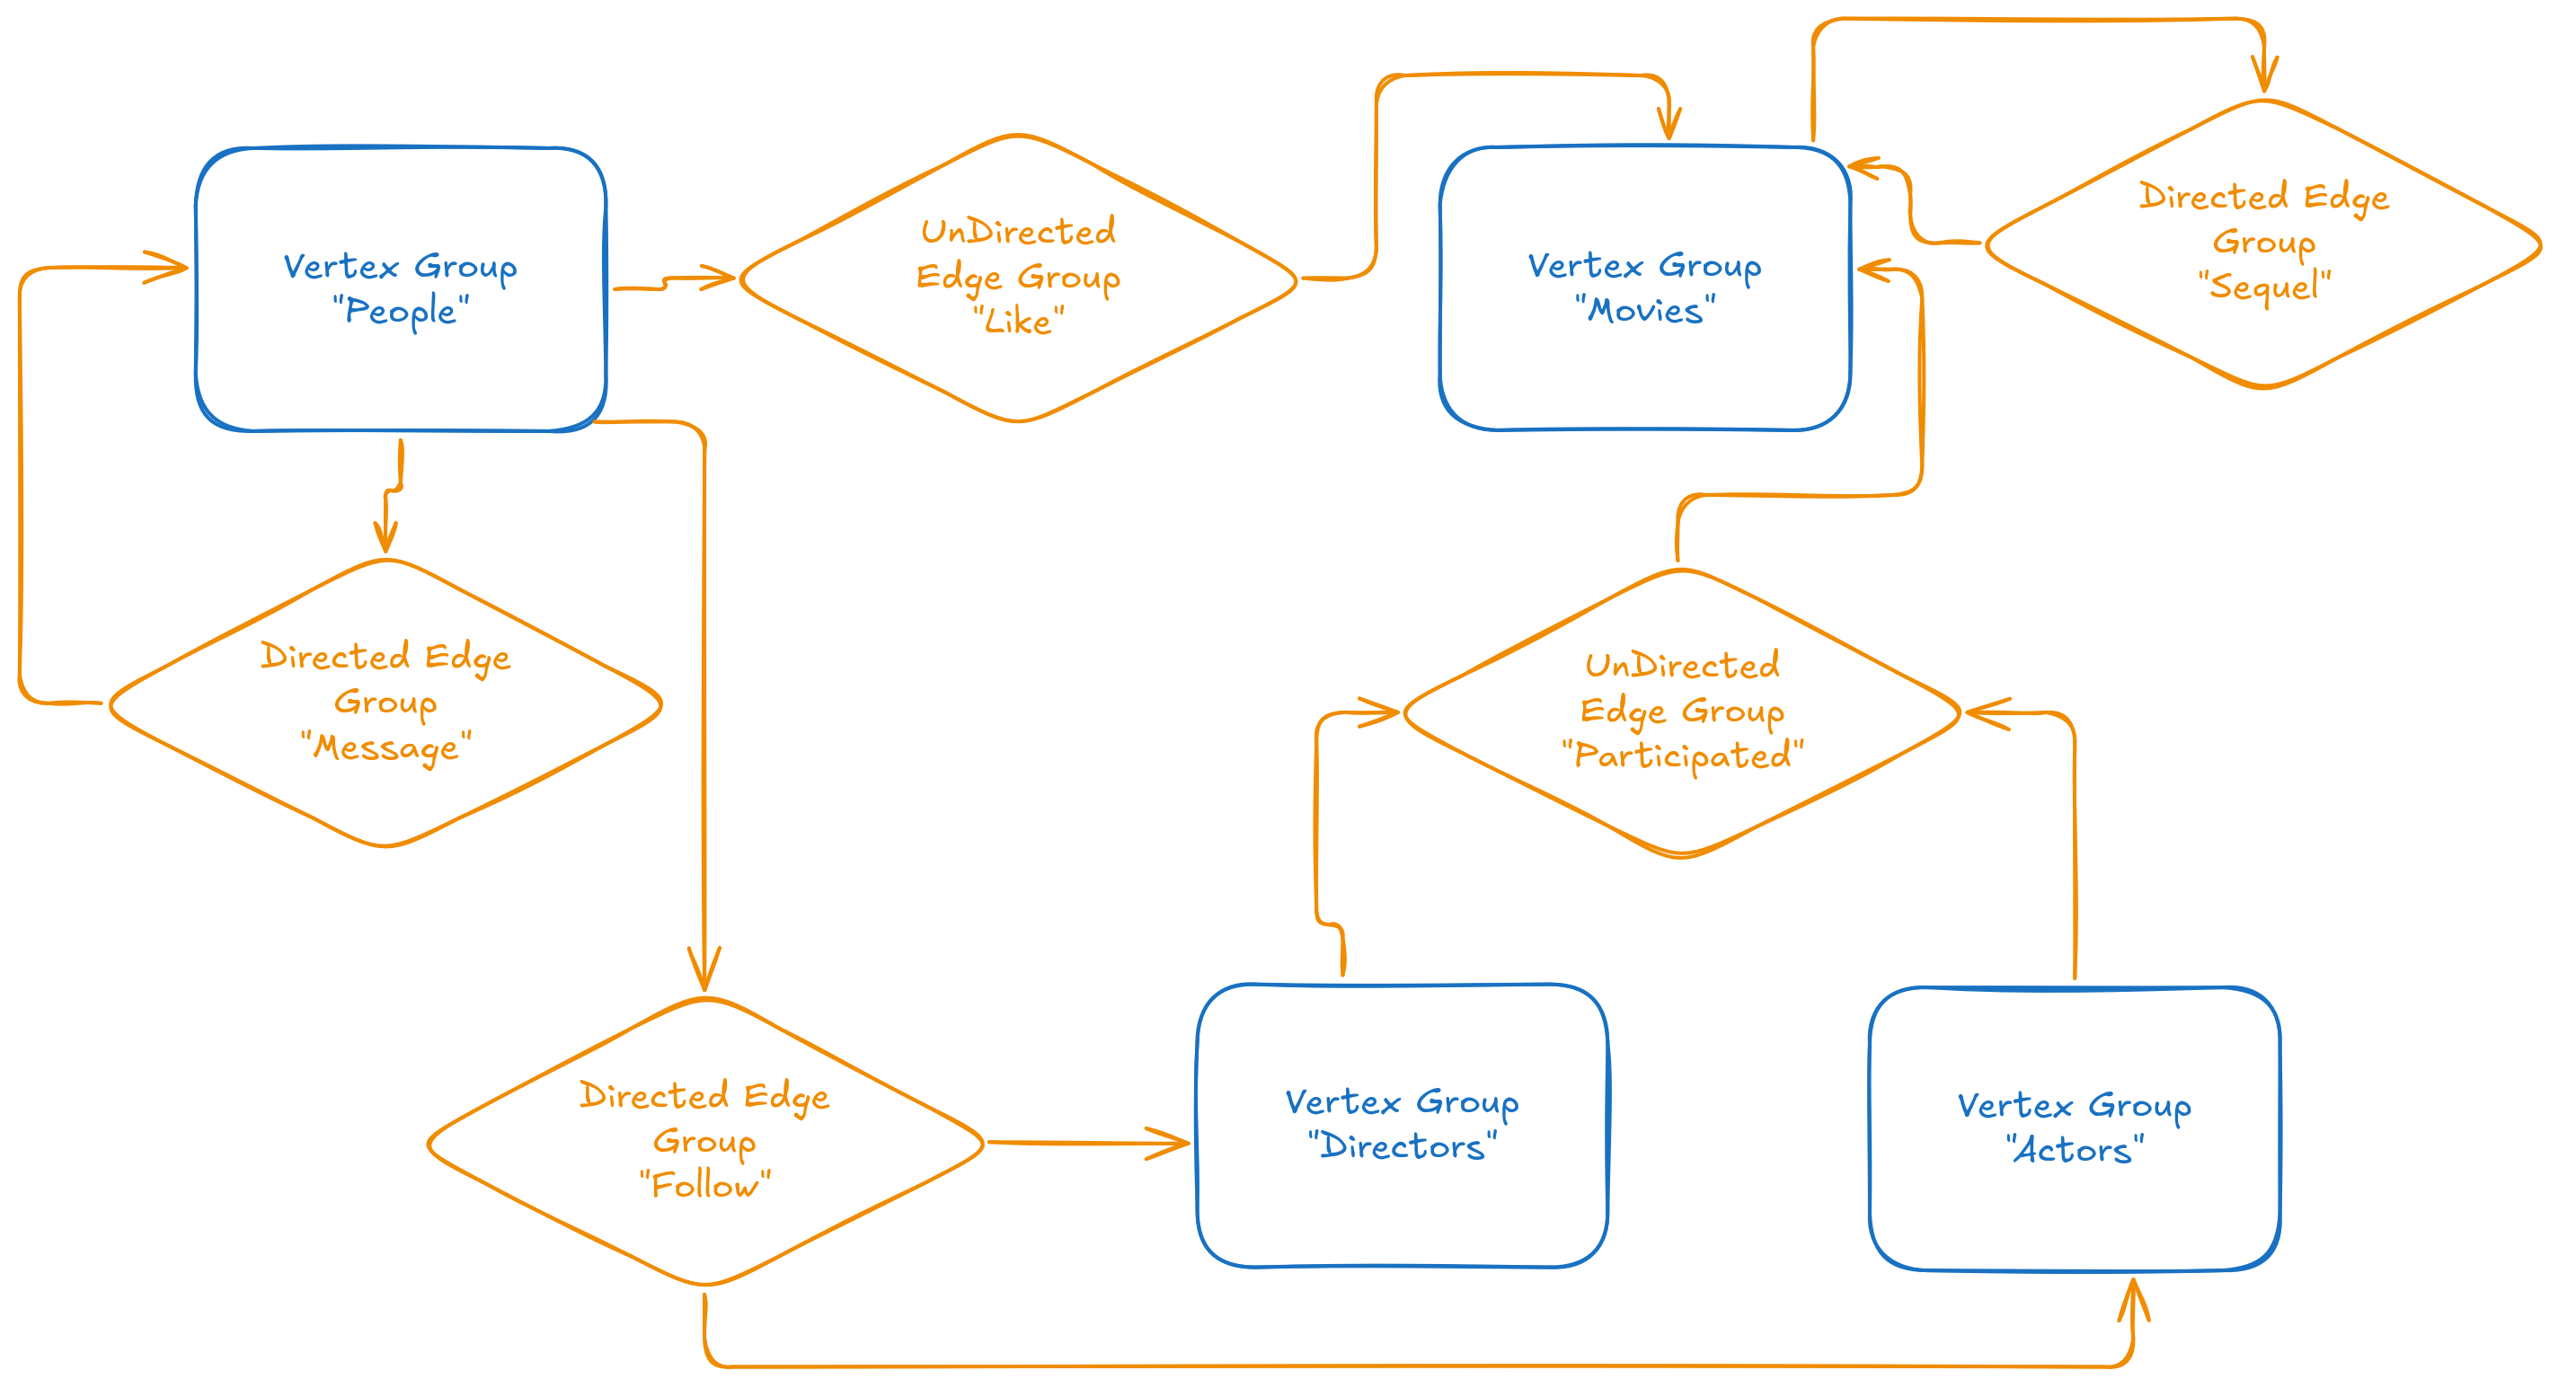
To make this concrete, I like the example of a “movie fan social network.” The diagram above shows how this looks as a property graph. There are people and movies – two types of vertices, each with their own properties. People can like movies (undirected edges), send messages to each other (directed edges), and follow directors. There are also actors and directors as separate vertex types. Movies can be connected as sequels. All these relationships and entities are easy to represent in a property graph, as shown in the diagram.
The property graph model is very universal. Take a banking payments network: there are legal entities, government services, individuals, exchanges, and goods. Each is a different vertex type. Payments are directed, weighted edges with properties like date and amount. Two legal entities sharing a board member form an undirected, unweighted edge with the director’s details as properties. This structure is great for compliance, KYC, and anti-fraud. It helps to see who is connected to whom and how closely.
Or consider an online marketplace. There are buyers, sellers, and products. Buyers purchase products from sellers. Sellers offer many products. All of this fits naturally into a property graph. This structure works well for recommendation systems. Recommending a product is basically a link prediction problem in the graph.
Another example is Organizational Network Analysis (ONA). Companies have departments, teams, and people, all connected in different ways. Teams assign tasks to each other. People have both formal and informal relationships. There are official and real hierarchies. ONA can reveal key employees, process bottlenecks, and even predict conflicts. It also helps improve knowledge sharing across the organization.
In short, the property graph model is flexible and expressive. It works well for many real-world domains.
Property Graphs in the Open Lakehouse
To make property graphs part of the Open Lakehouse, we need three things: a storage standard, a metadata catalog, and tools for different graph tasks. This is just my personal view. With tools, everything is fine—there are plenty of options for ETL-like processing, analytics, ML/AI, and visualization. But with storage standards and catalogs for graphs, things are much less developed. Most of the ecosystem is still focused on tables, and there’s no widely adopted open format or catalog for property graphs yet.
Graph Processing tools
Let’s look at three open source tools for working with property graphs. First, GraphFrames. For me, this is like Spark for Apache Iceberg. It scales well and handles huge, long-running batch jobs with reliable distributed processing. Second, Apache HugeGraph (incubating). This is like ClickHouse or Apache Doris for Apache Iceberg. You need a separate server, but you get a great tool for analysts. They can run interactive graph queries using Gremlin or OpenCypher. These are standard query languages for graphs. They let you, for example, find a vertex’s neighborhood up to two hops, or discover all vertices connected through certain types of edges within one to three steps. Third, KuzuDB. I see it as DuckDB for graphs. No separate server is needed. It works in-memory and in-process, with the usual single-node limitations. If your graphs fit into single-node processing, Kuzu is a great tool for both ETL and analytics. It has full OpenCypher support.
GraphFrames
Since I’m currently the most active maintainer of GraphFrames, I know this framework best from the inside. I’ve prepared a diagram to show how it works.
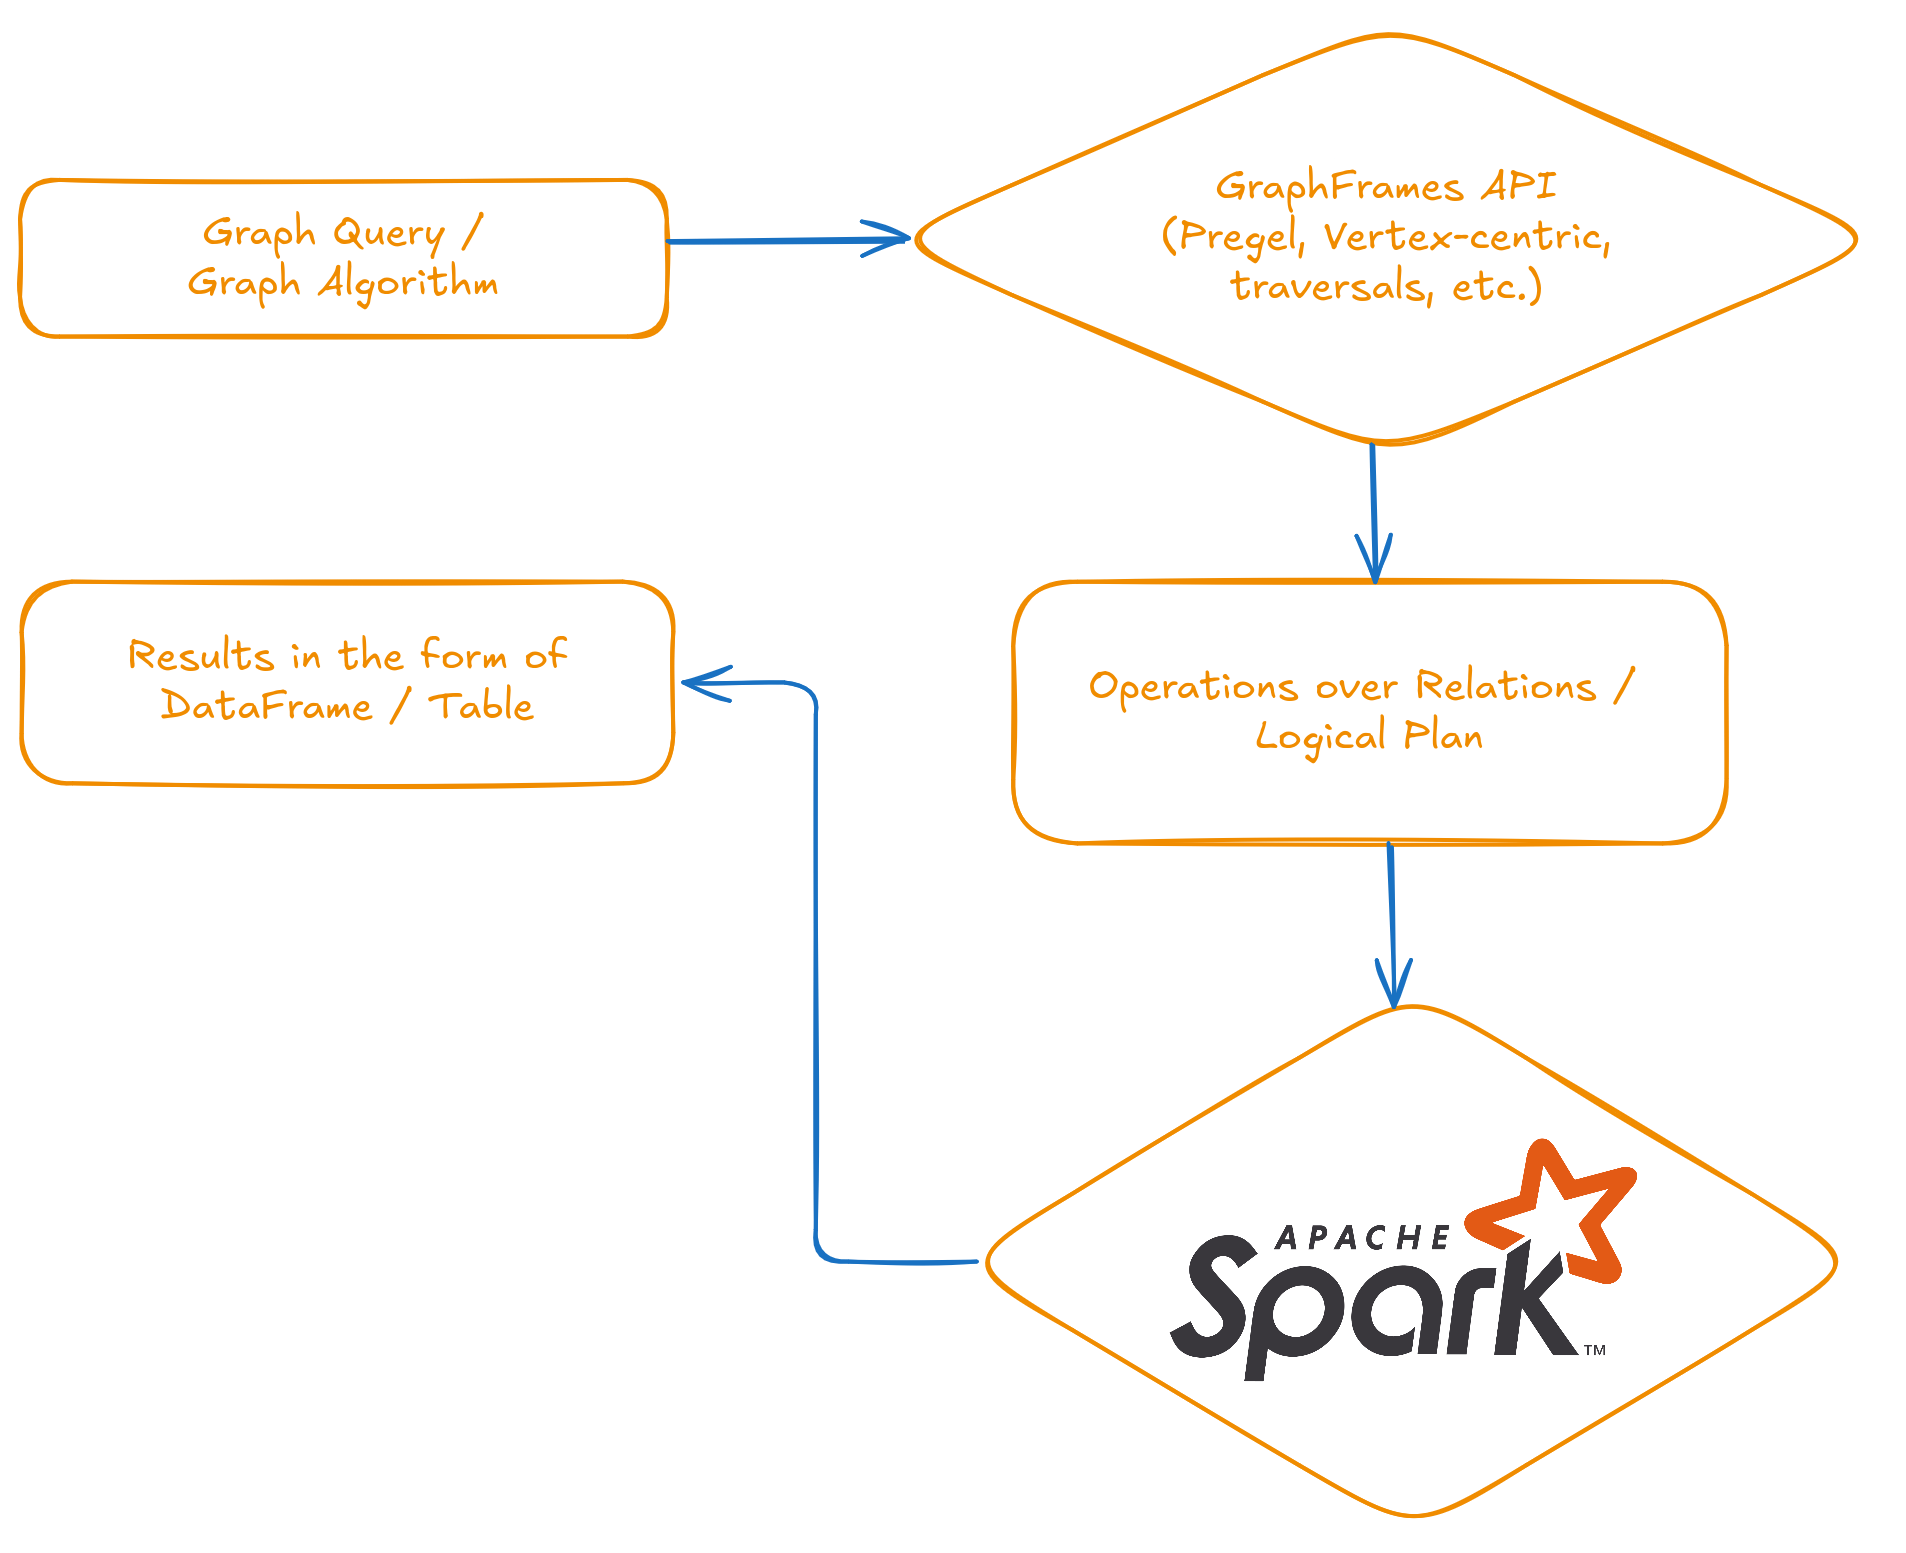
GraphFrames gives users an API and abstractions for working with graphs, pattern matching, and running algorithms. Under the hood, all these operations are translated into standard relational operations – select, join, group by, aggregate – over DataFrames. DataFrames are just data in tabular form. The translated logical plan runs on an Apache Spark cluster. The user always gets results back as a DataFrame, which is simply a table.
Let’s look at a concrete example – PageRank. This algorithm became famous for powering Google Search (fun fact: “Page” is actually the last name of Google co-founder Larry Page, not just about web pages). PageRank helps find the most “important” nodes in a graph, like ranking web pages by relevance.
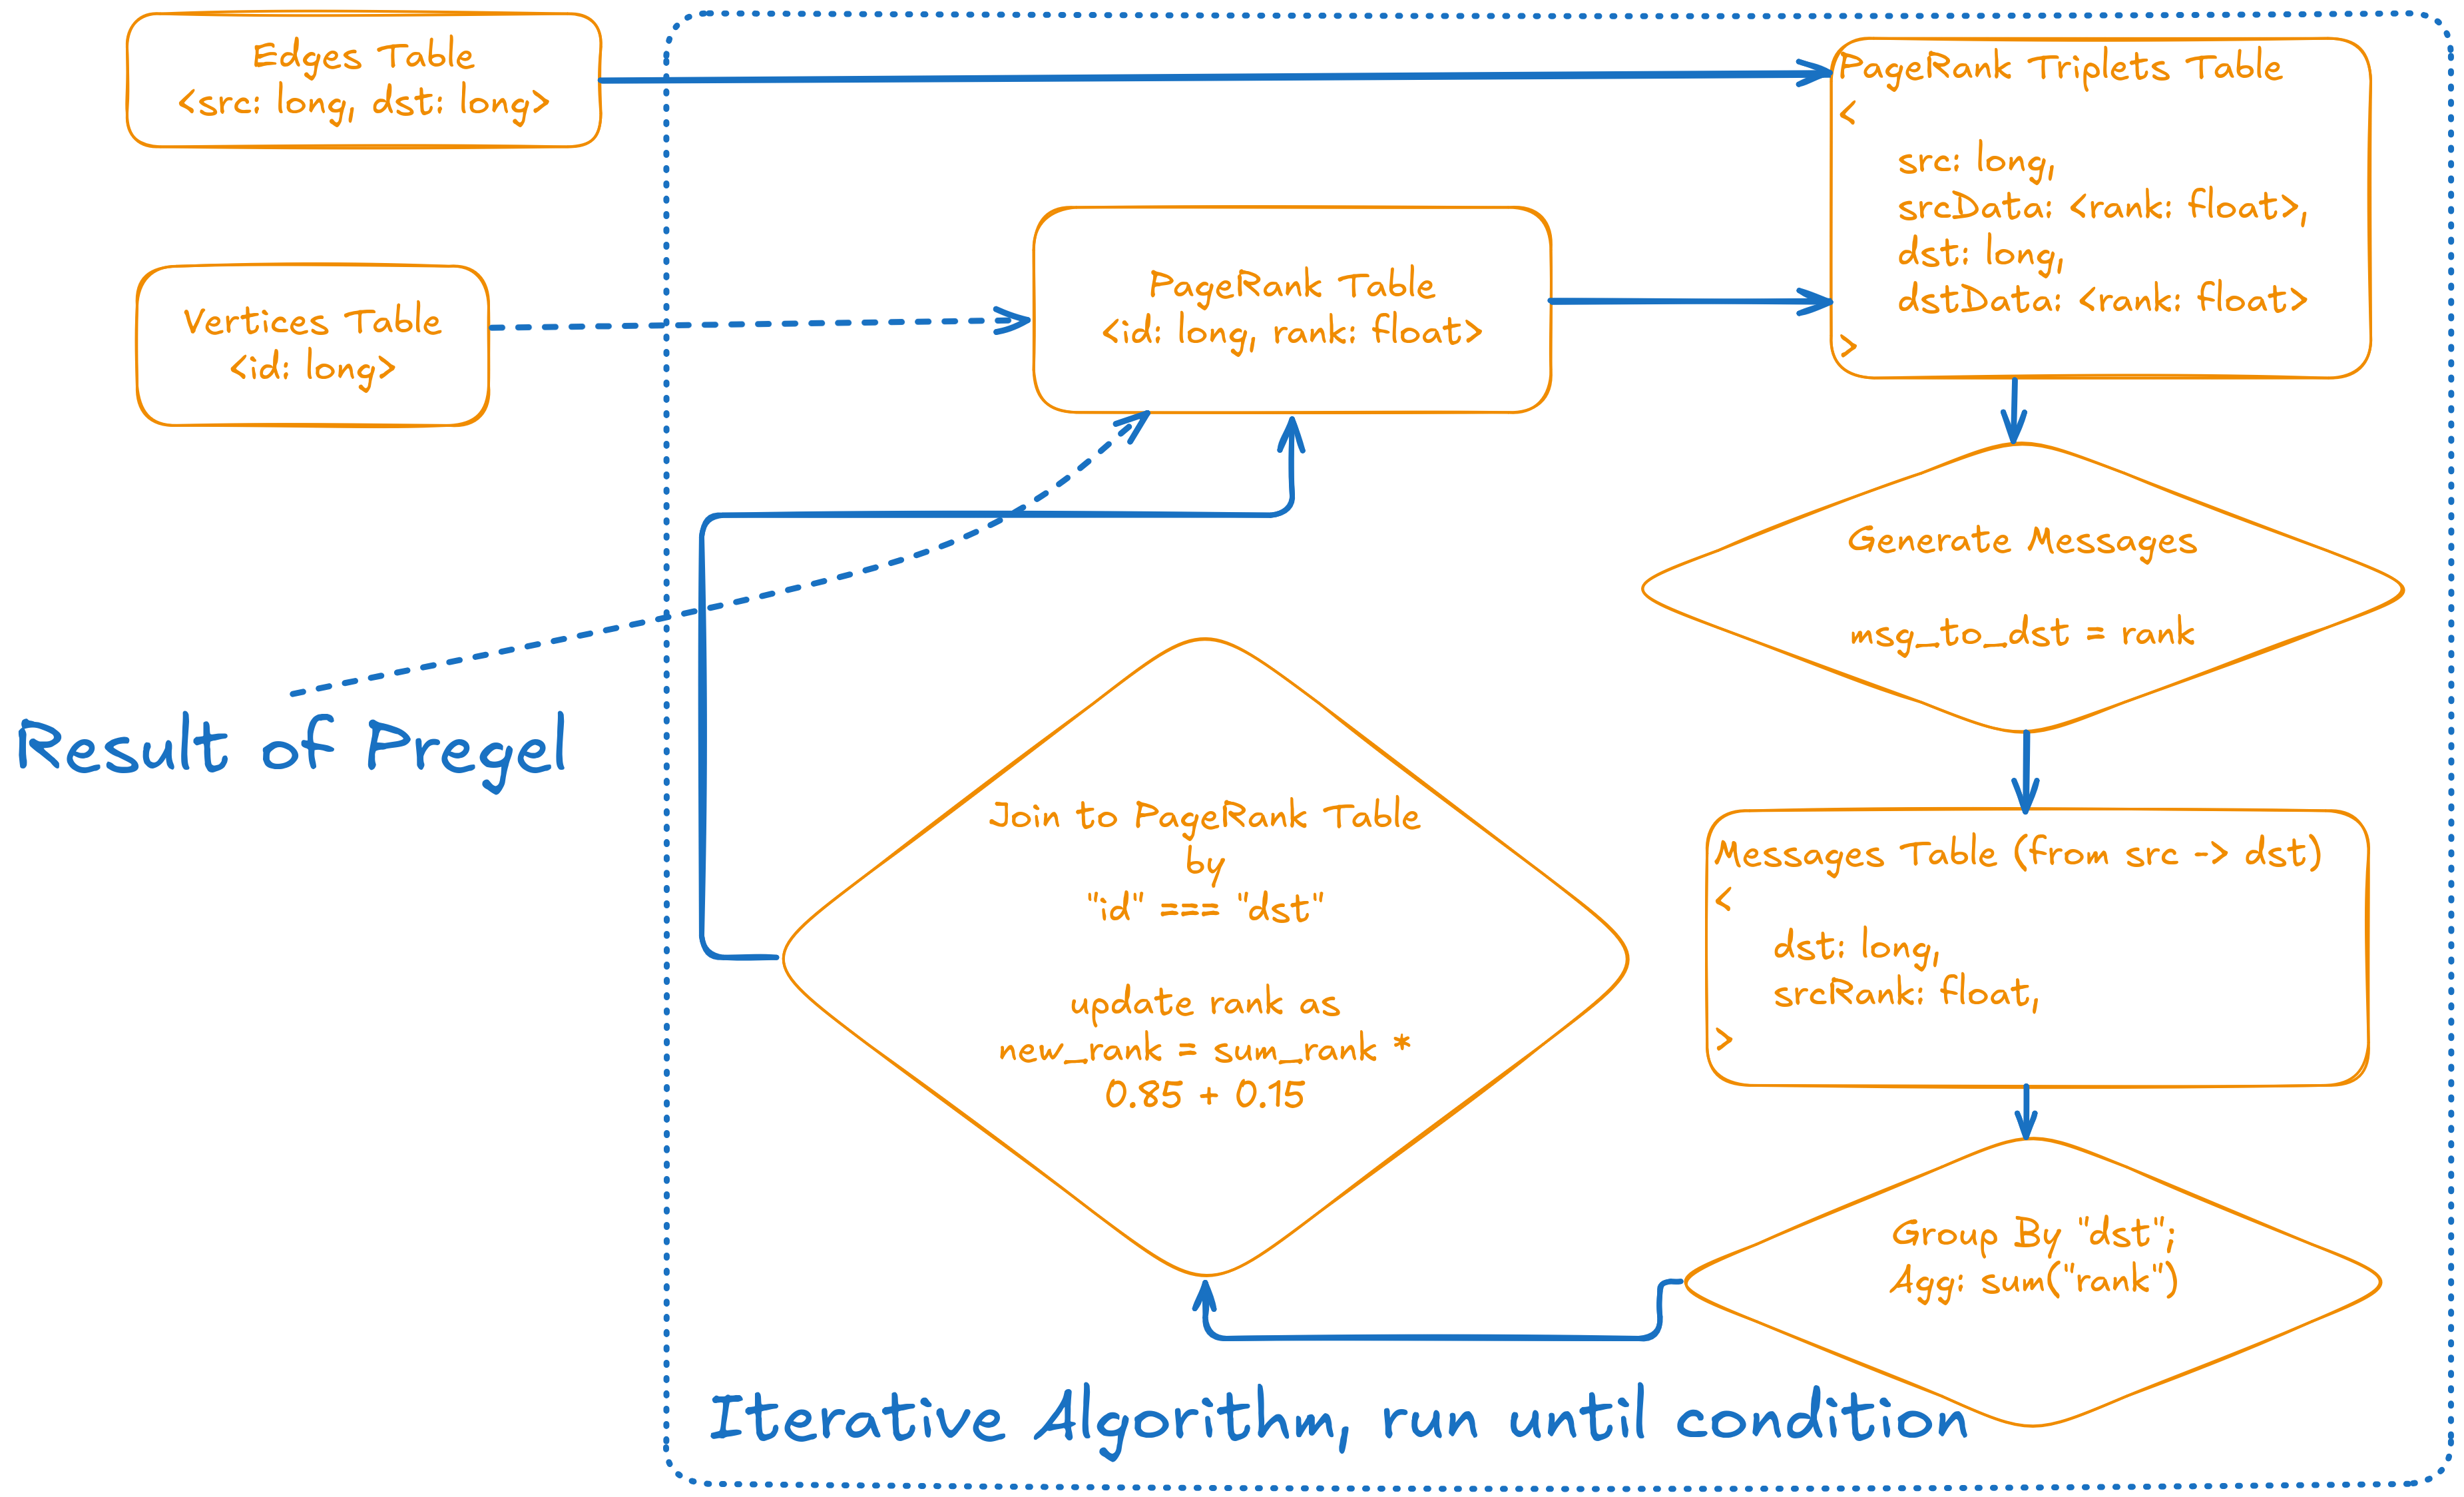
In GraphFrames, most algorithms – including PageRank – are built on the Pregel framework (Malewicz, Grzegorz, et al. "Pregel: a system for large-scale graph processing." Proceedings of the 2010 ACM SIGMOD International Conference on Management of data. 2010.). We represent the graph as two DataFrames, which you can think of as tables: one for edges and one for vertices. The PageRank table is initialized by assigning every vertex a starting rank of 0.15.
Each iteration of PageRank works like a series of SQL operations. The process starts by joining the edges table with the current PageRank values for each vertex. This creates a triplets table, where each row contains a source, destination, and their current ranks. Next, we generate messages: each source sends its rank to its destination. These messages are grouped by destination and summed up. Finally, we join the results back to the PageRank table and update the rank using a simple formula: new_rank = sum_rank * 0.85 + 0.15.
This whole process is repeated – each step is just a combination of joins, group by, and aggregates over tables – until the ranks stop changing much. The algorithm converges quickly, usually in about 15–20 iterations. Since it relies entirely on SQL operations, running PageRank on an Apache Spark cluster gives you excellent horizontal scalability. As long as your tables fit in Spark, you can compute PageRank using Pregel. In practice, this means you can almost infinitely scale just by adding more hardware.
Kuzu DB
I should mention up front that I know KuzuDB only as a user, so everything here is based on their documentation and public materials.
KuzuDB is an embedded, in-process graph database designed for speed and analytics on a single machine. It stores graph data using a columnar format, including a columnar adjacency list—basically, a fast and compressed way to represent which nodes are connected. This approach enables extremely fast joins and efficient analytical queries, even for complex graph workloads. All data is stored on disk in a columnar layout, which helps with both speed and compression. As a result, KuzuDB delivers high performance for graph analytics without needing a separate server. If your graph fits on a single node, KuzuDB is a great choice for ETL, analytics, and any workload where you want fast, in-memory processing with full OpenCypher support.
Apache HugeGraph (incubating)
I should state upfront that I'm only superficially familiar with Apache HugeGraph, and most of what I know about its architecture comes from the documentation. Apache HugeGraph is not like Kuzu or GraphFrames, as it requires a standalone server to run on.
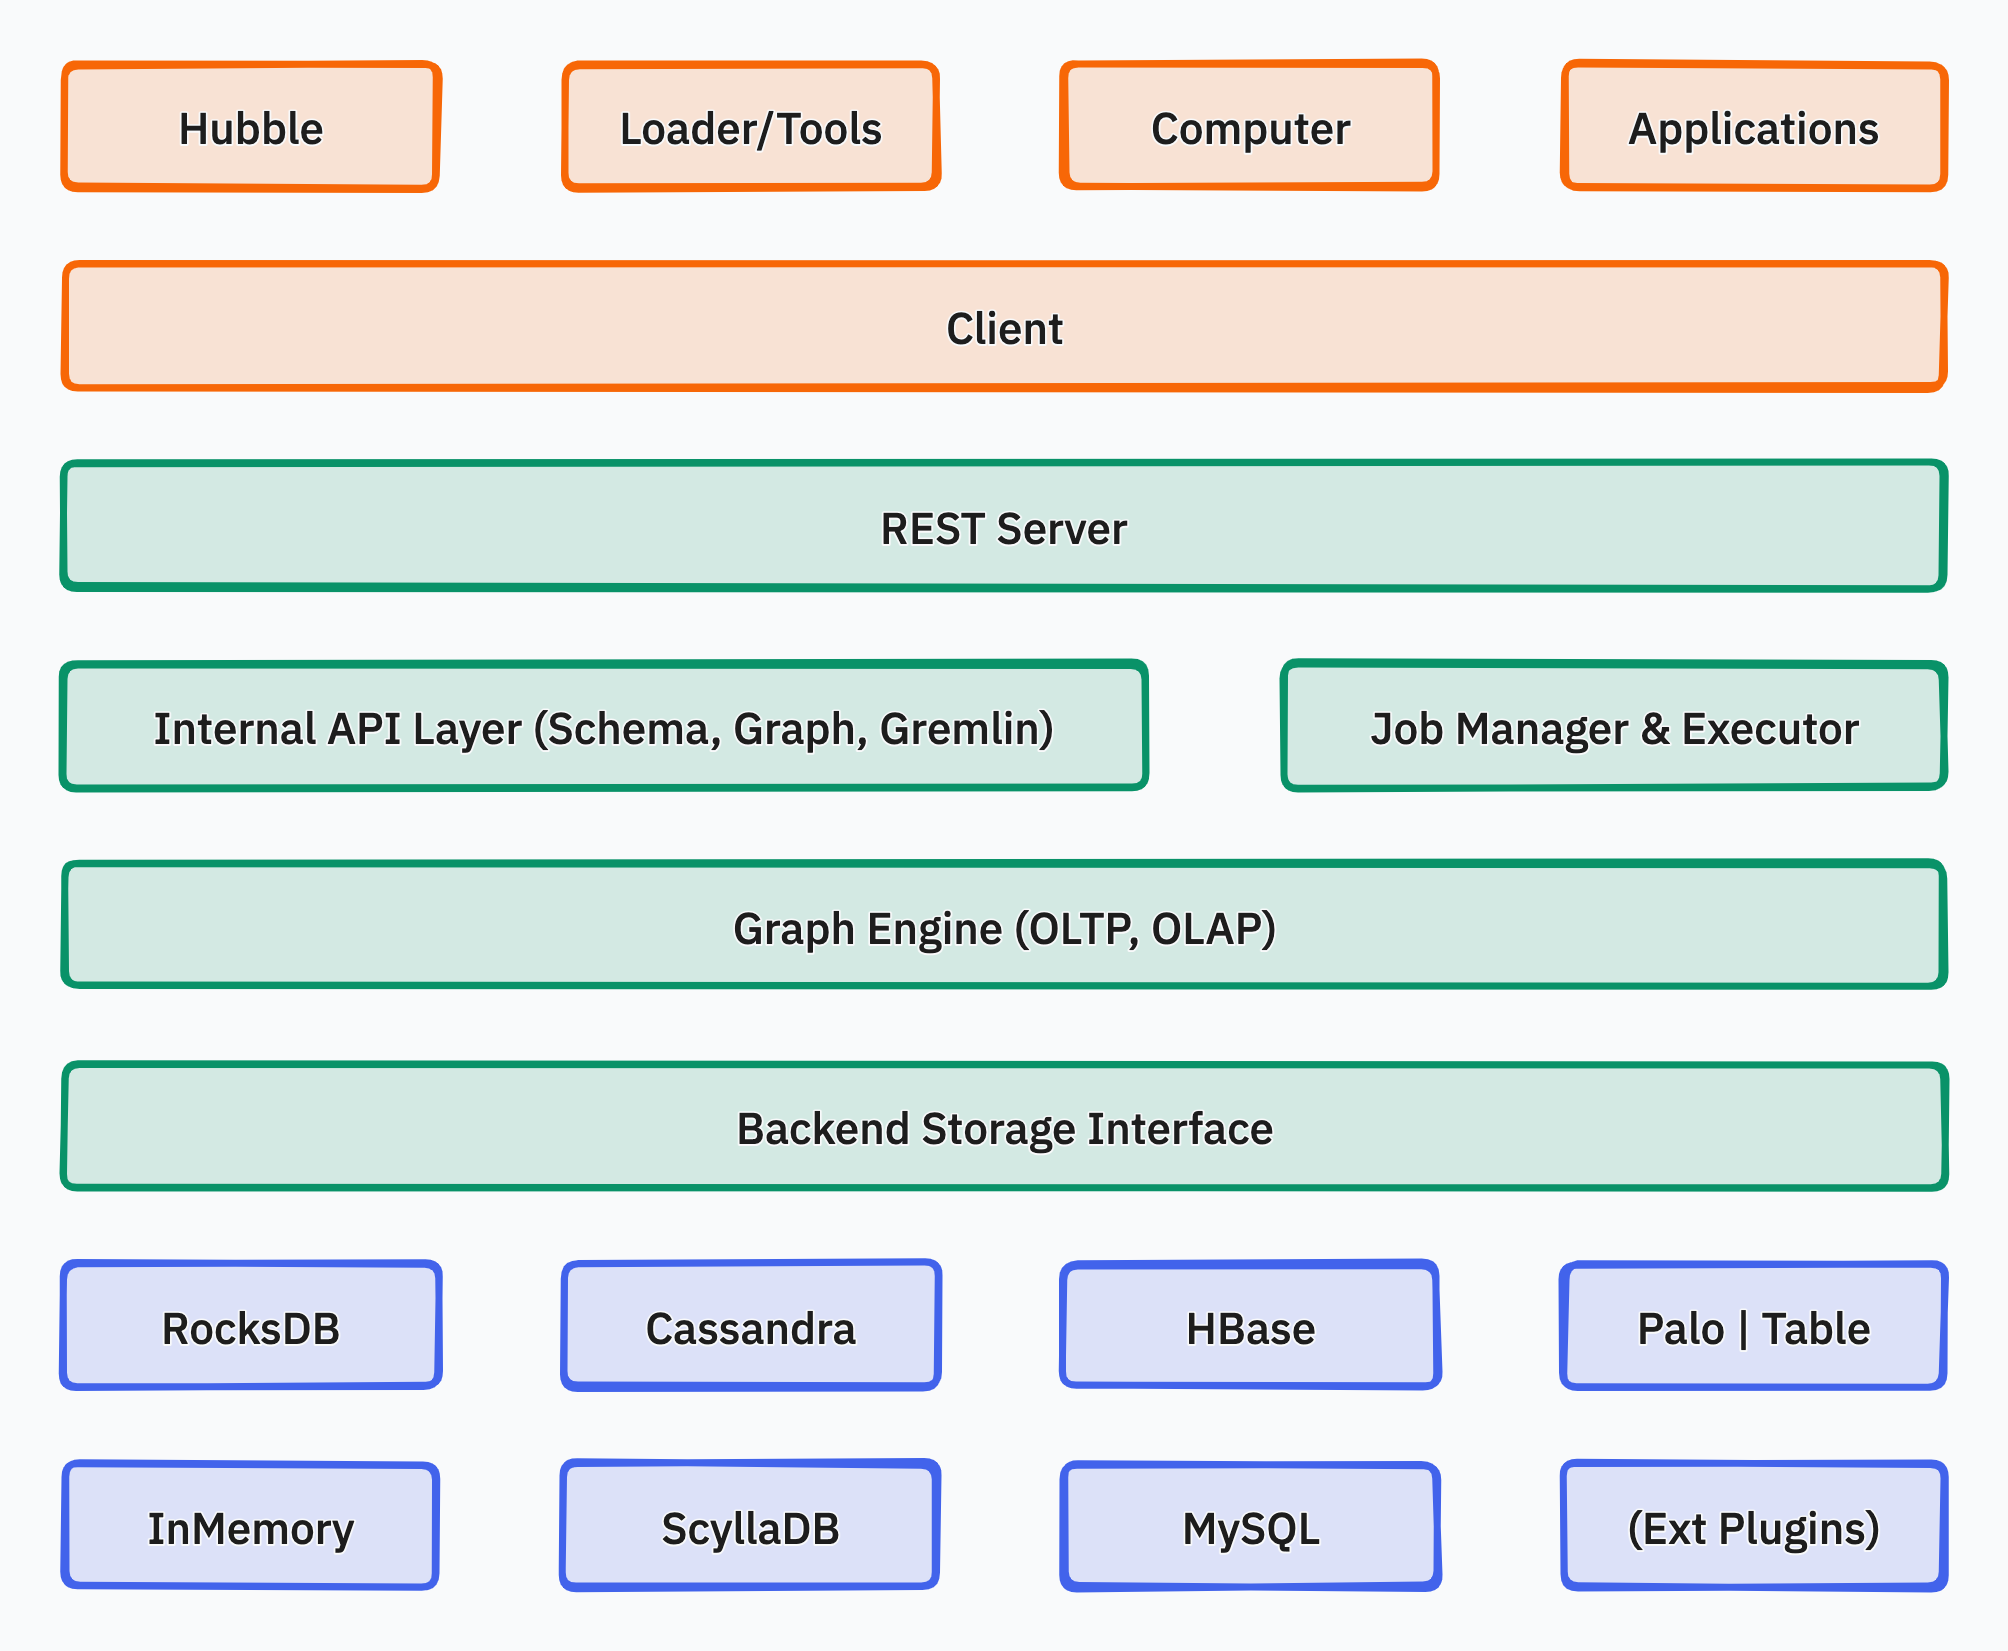
HugeGraph has three main layers. The Application Layer includes tools like Hubble for visualization, Loader for importing data, command-line tools, and Computer – a distributed OLAP engine based on Pregel (yes, that’s the same Pregel framework I described in the GraphFrames section). There’s also a client library for developers.
The Graph Engine Layer is the core server. It exposes a REST API and supports both Gremlin and OpenCypher queries. This layer handles both transactional (OLTP) and analytical (OLAP) workloads.
The Storage Layer is flexible. You can choose different backends, like RocksDB, MySQL, or HBase, depending on your needs. This modular design lets you scale from embedded setups to the distributed storage. Overall, HugeGraph is built for both interactive and analytical graph workloads, with full support for Gremlin and OpenCypher.
Storage: Apache GraphAr (incubating)
The only standard for Property Graph storage that I know of today is Apache GraphAr (incubating) (GraphAr means Graph Archive). I should add that I’m a member of the GraphAr PPMC committee, but I’ve honestly searched for other attempts to create a similar standard and haven’t found any.
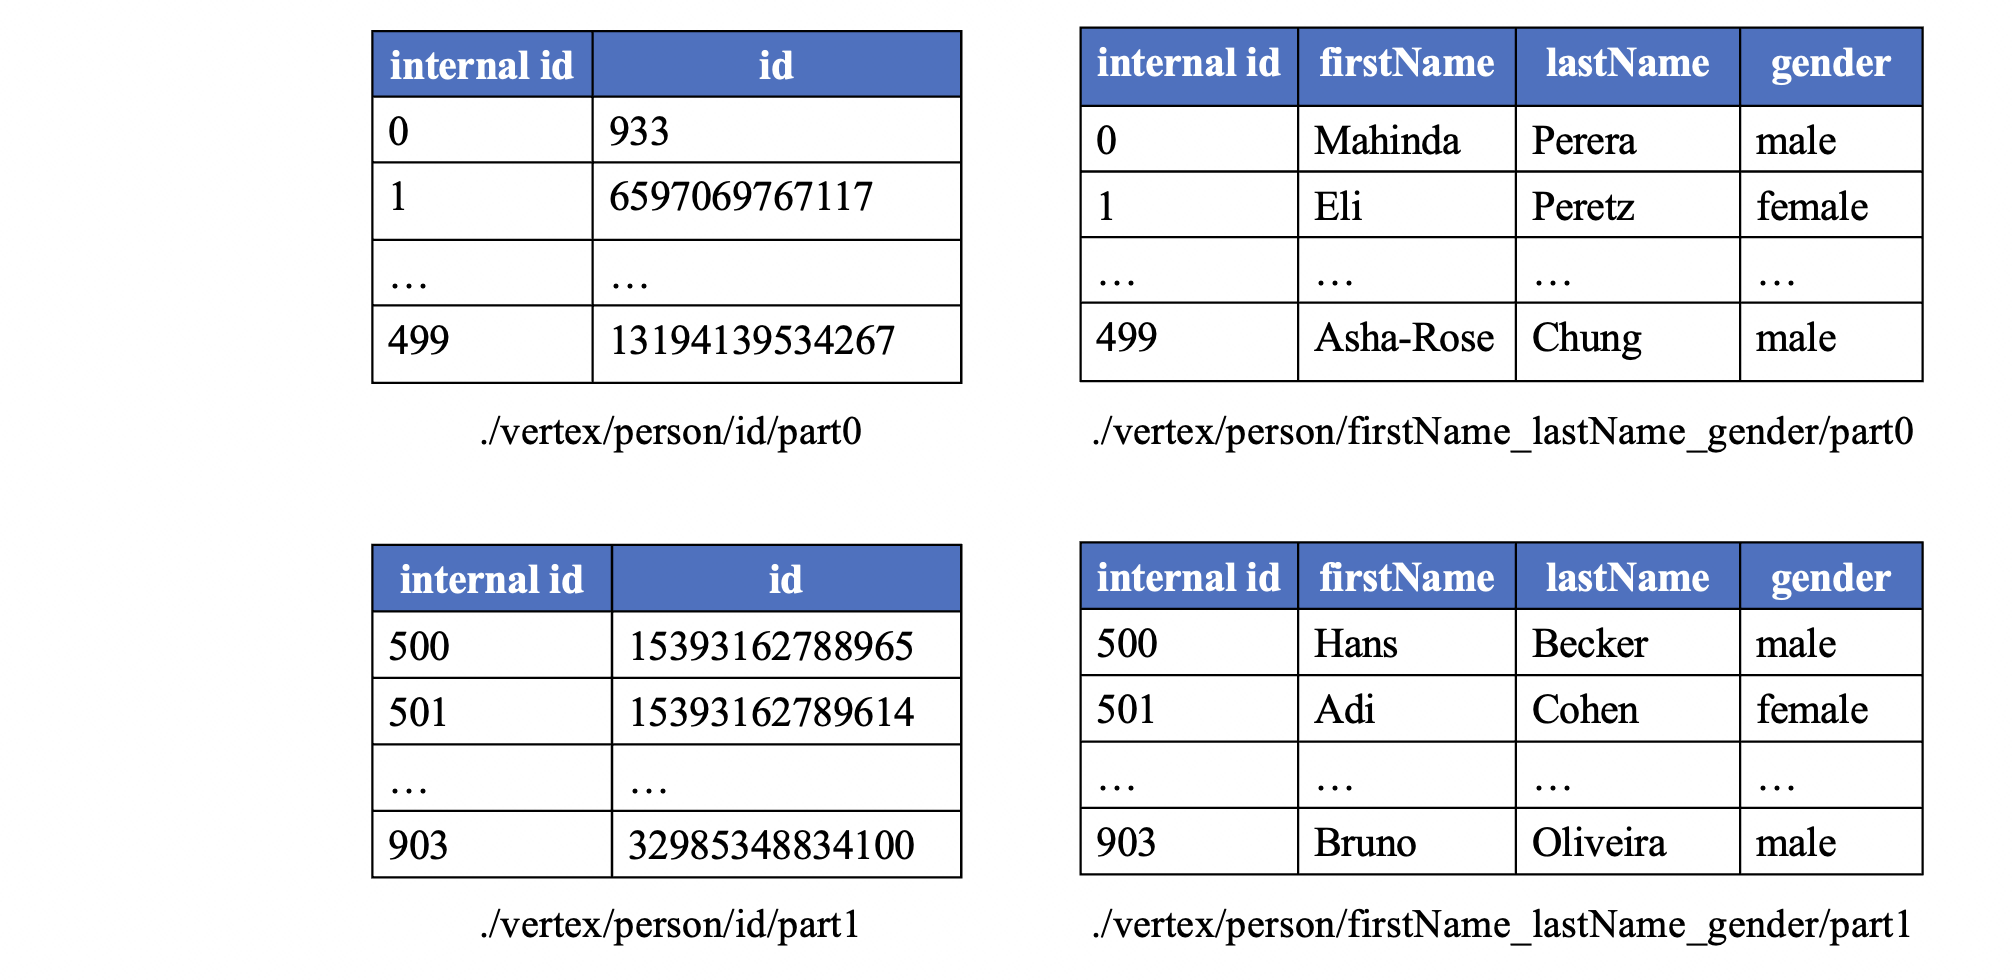
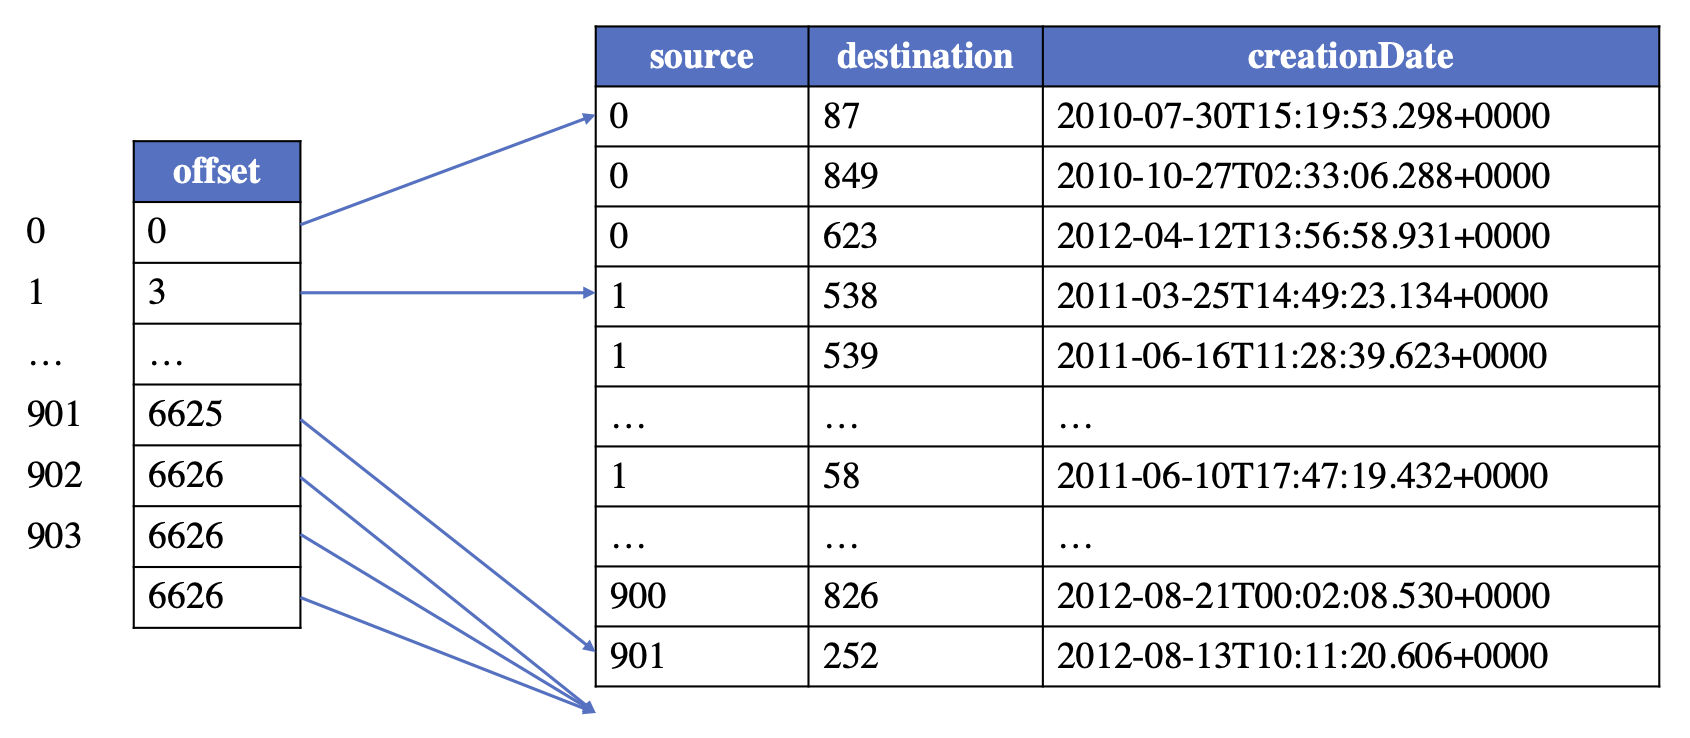
The core idea behind GraphAr is simple: you can think of it as Delta Lake, but for graphs. Data is stored in a columnar format—using Apache Parquet or Apache ORC files. Alongside the data, there are human-readable YAML metadata files. GraphAr represents Property Graphs as logical Property Groups for both vertices and edges. Each group has its own schema (properties), keys for vertices, and attributes like edge directionality. Internally, there are unique LONG indices for vertices and edges. The format is optimized for query engines: for example, there are edge offset tables for every vertex.
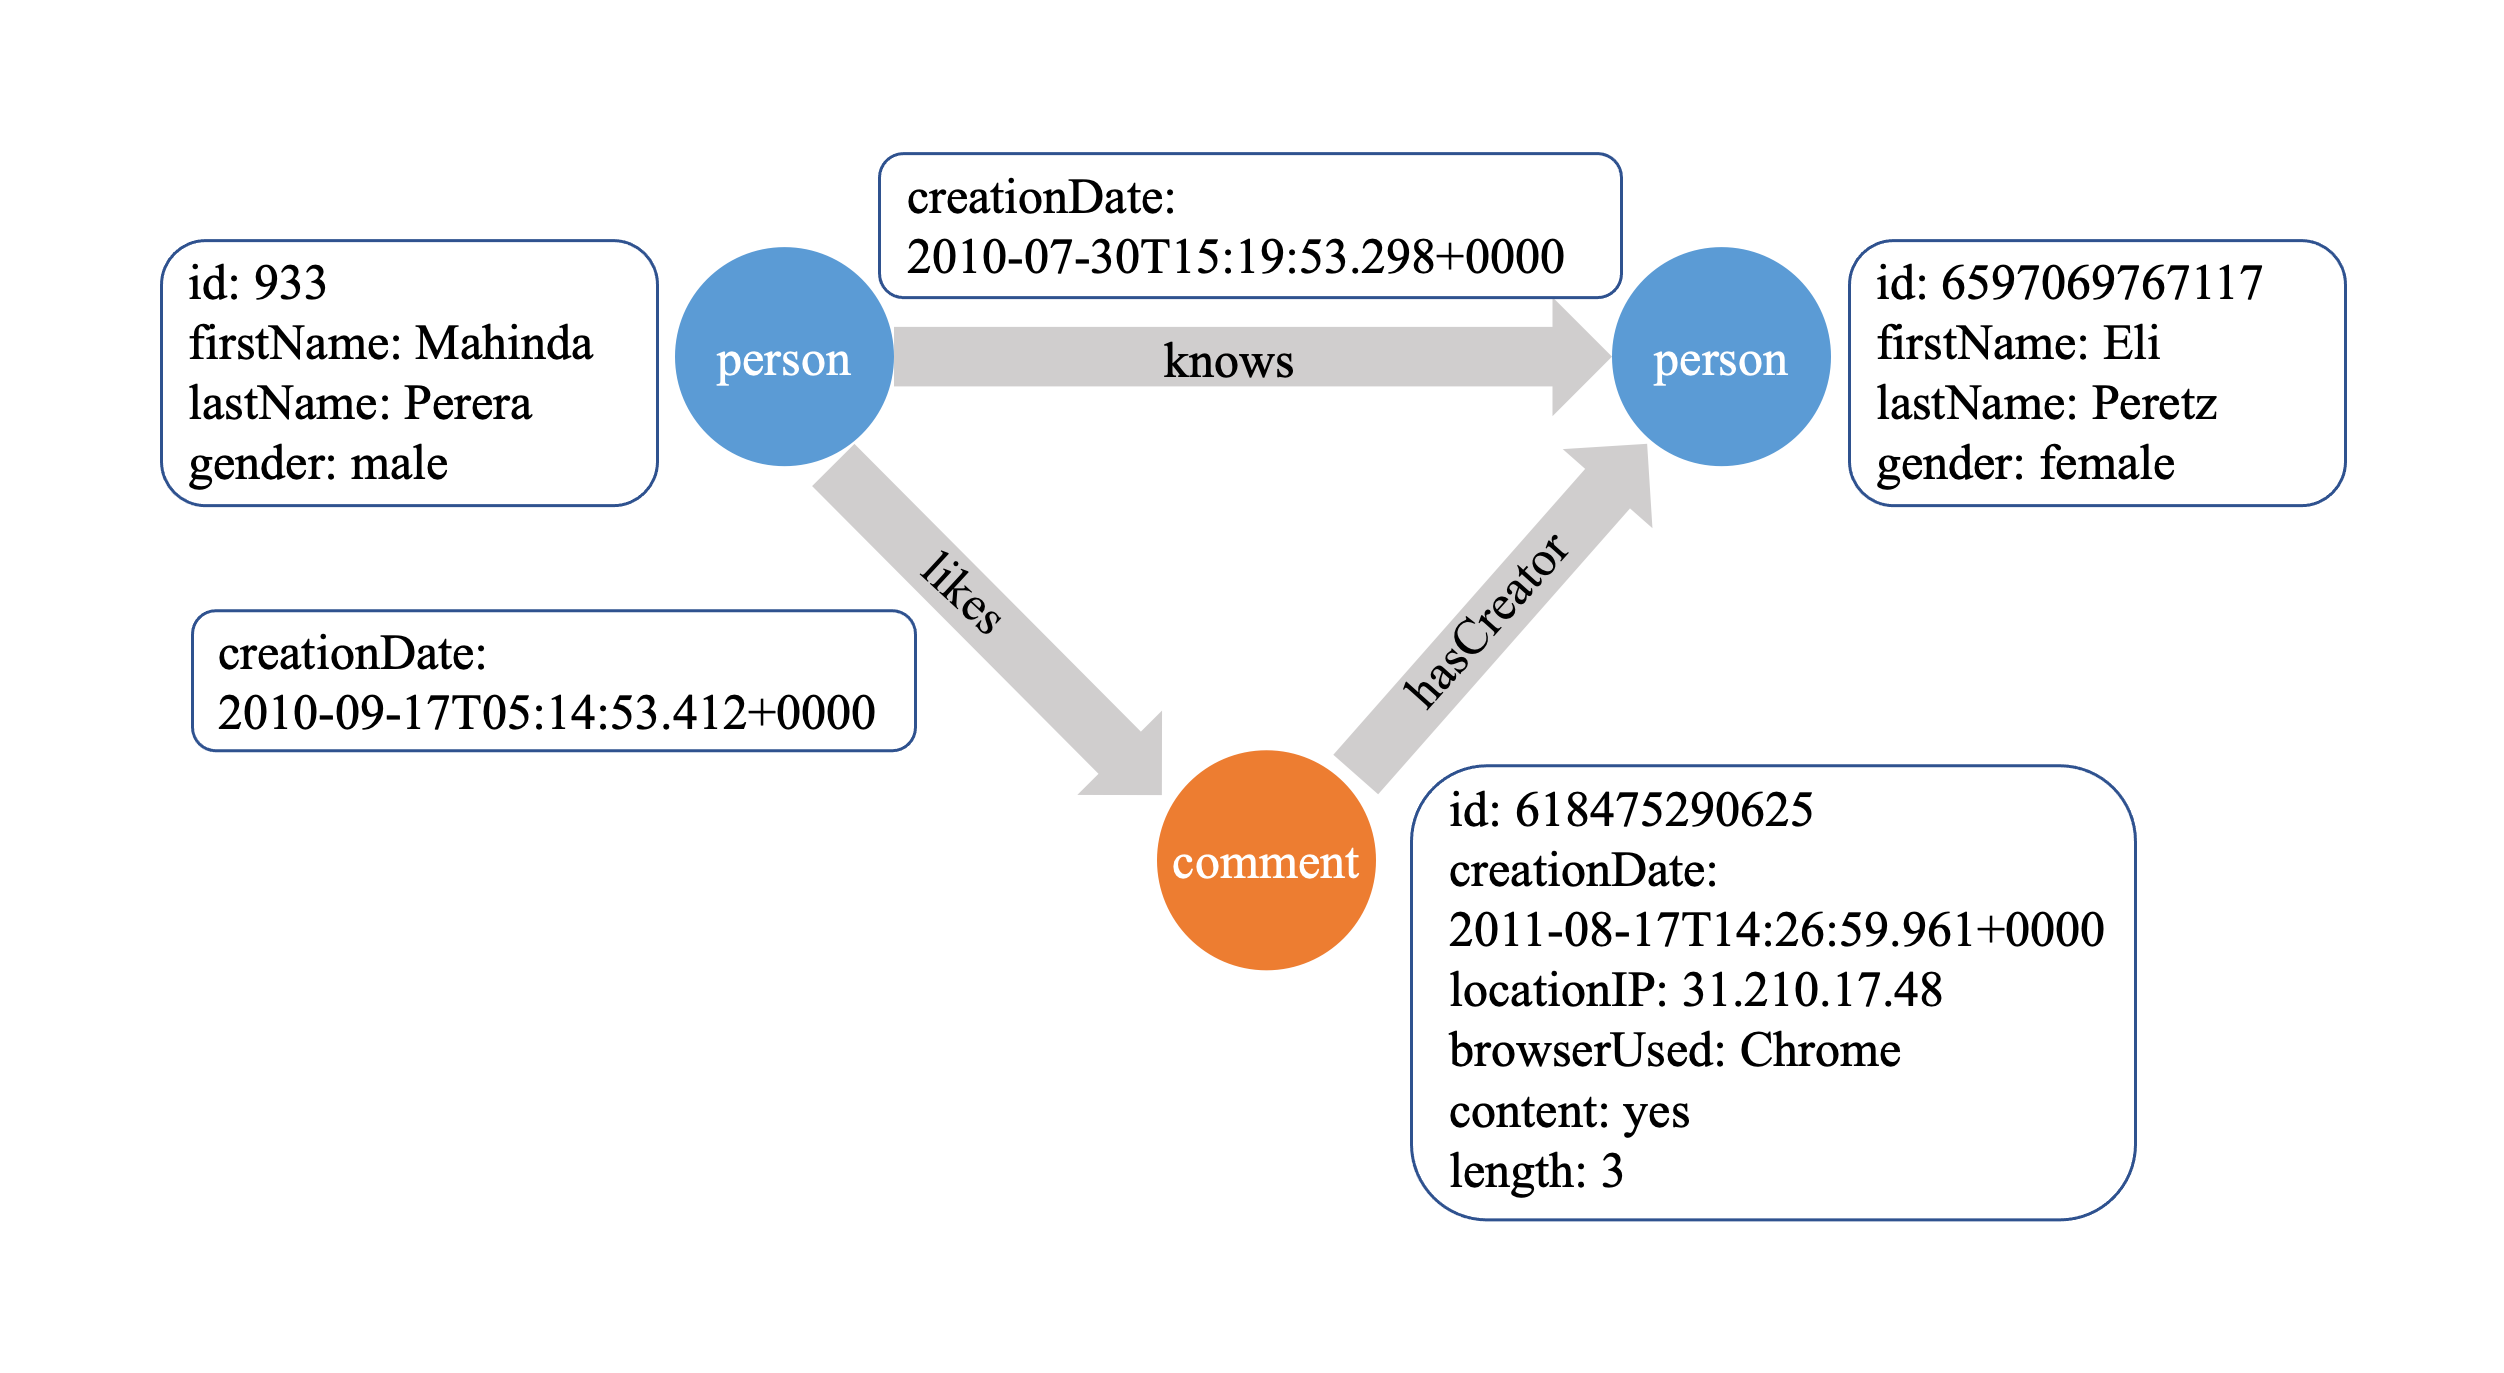
The optimization principle is based on the fact that real-world graphs are usually clustered. By sorting data by vertex, we achieve excellent compression in Parquet, since properties and their values tend to be similar within clusters. Metadata, grouping, and data sorting open up a lot of room for query optimization. The optimizer can push down entire groups and skip reading files using min-max metadata in Parquet headers.
Right now, there’s a reference C++ API for GraphAr. There’s also an Apache Spark and PySpark API, which I’m actively helping to develop. A standalone Java API (not tied to Apache Spark) is in progress. There’s even a CLI tool, modeled after Parquet Inspector, built on top of the C++ API.
Brining all together
Bringing everything together, the architecture looks surprisingly clean and modular.
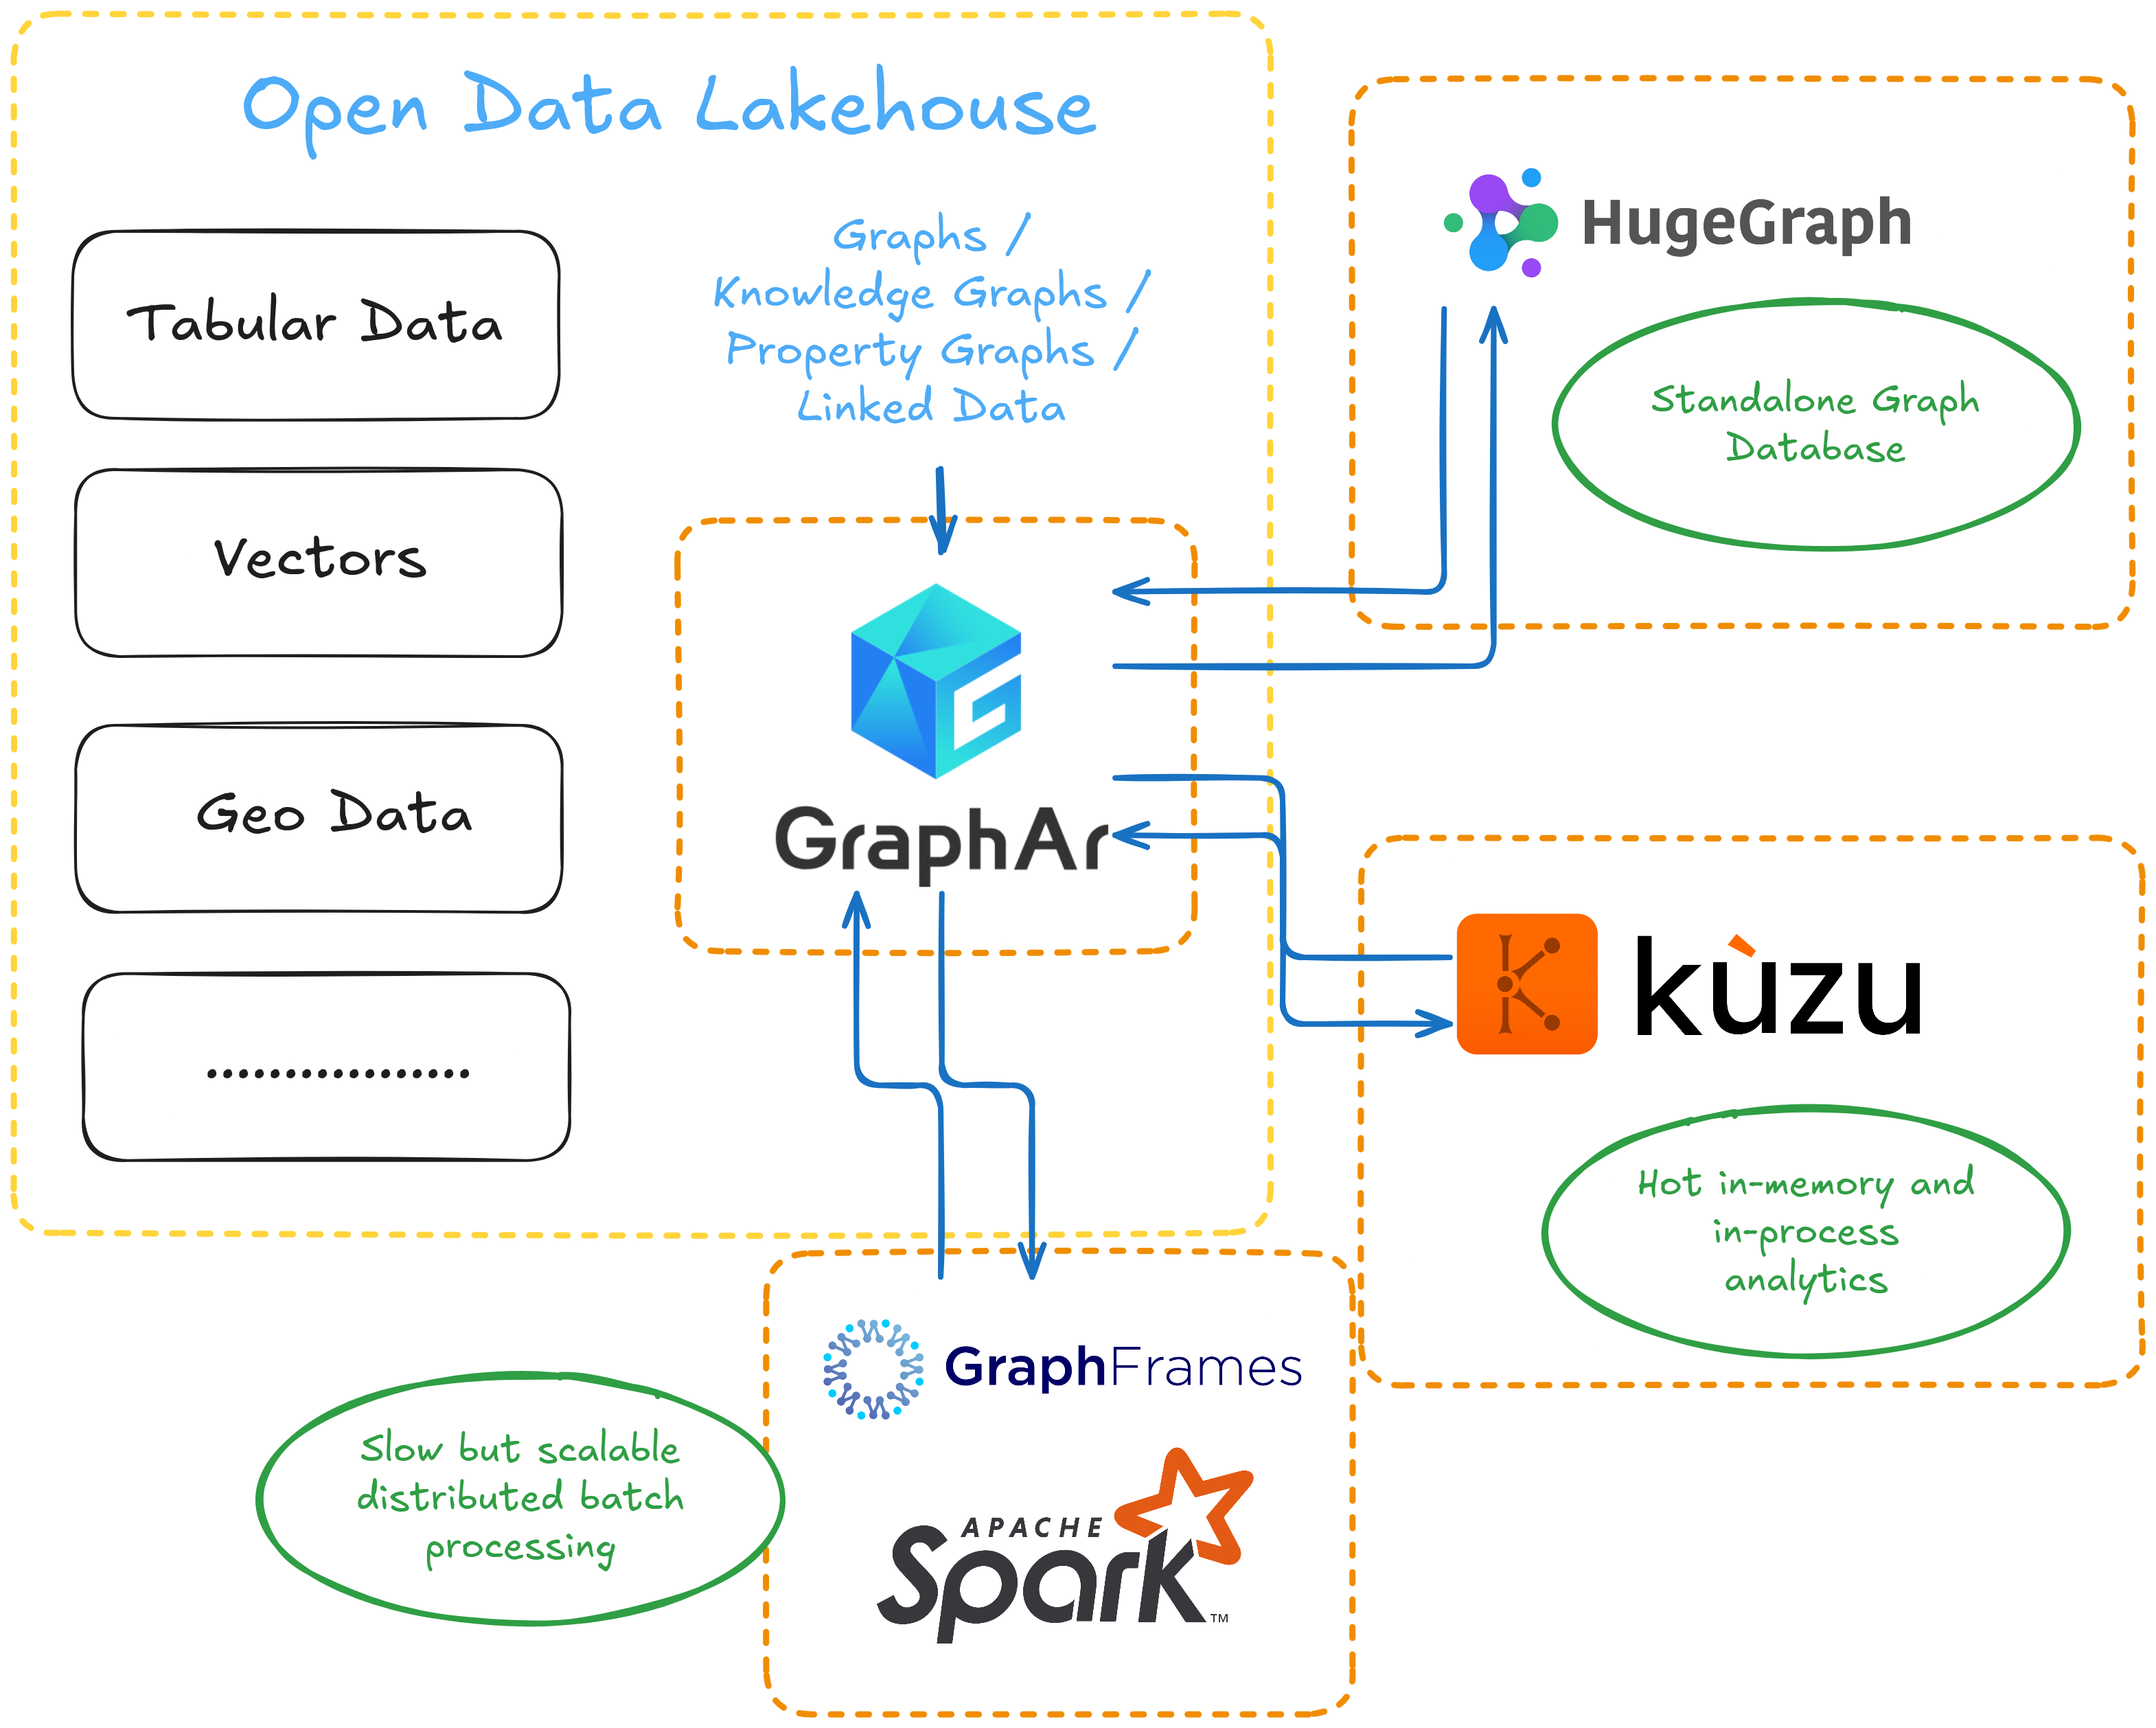
At the center is the storage standard—GraphAr—which acts as the “Delta Lake for graphs.” All graph data, whether from batch analytics or interactive workloads, is stored in a unified, open format. Around this core, different tools plug in depending on your needs. GraphFrames provides scalable, distributed analytics and ETL on Spark. KuzuDB offers fast, in-process analytics for single-node workloads. HugeGraph covers the interactive, OLAP, and OLTP scenarios with full support for Gremlin and OpenCypher. Each tool can read and write to GraphAr, so you’re never locked into one engine or workflow.
This modular approach means you can mix and match tools as your requirements change. For example, you might use Spark and GraphFrames for heavy ETL and analytics, then switch to KuzuDB for fast, local exploration, or to HugeGraph for interactive graph queries and visualization. The open storage format ensures that your data remains portable and future-proof, no matter which engine you choose.
Now for the current status. After several years in maintenance mode, I and other enthusiasts have revived GraphFrames and started releasing new versions. I’m now finishing the Property Graph implementation in GraphFrames. Once my pull request is merged, integrating with GraphAr should be straightforward, since GAR already provides a Spark DataSource.
For KuzuDB, I reached out to the developers – they’re cool guys and it looks like they liked the idea of integrating with GAR. They’ve promised to stabilize their extension API and improve the documentation to make this possible.
As for HugeGraph, the team is waiting for GraphAr’s Java API to stabilize. Once that happens, they’re interested in integrating with the format as well.
Bonus Part 1: catalog integration
In theory, you could also add a catalog layer to this picture. Options like Apache Polaris or other Iceberg Catalogs probably won’t work – they’re focused only on tables and Apache Iceberg. But solutions like Unity Catalog seem much more promising and could likely be extended to support graphs. I even asked about this in the Unity repo, though I haven’t received a response yet. Since Unity is written in Java, I could potentially add this integration myself if the maintainers are open to the idea.
Bonus Part 2: Apache DataFusion integration
Right now, I’m also working on bringing graphs into the Apache DataFusion ecosystem by rewriting GraphFrames in Rust. I’ve just started, but the core-Pregel engine is already done – and it even passes tests. The next step is to implement the graph algorithms themselves.
Conclusion
In the end, I dream of seeing graphs become a natural part of the Open Lakehouse ecosystem. I believe this would unlock a whole new set of possibilities – especially now, in the age of AI, Graph-RAG, and Knowledge Graphs. And it’s not just a dream – I’m actively working to make it real. I hope it was interesting to read and I will be happy to hear any feedback!
