
Preface
I’m the maintainer of the GraphFrames library, which provides algorithms and abstractions for working with linked data (Graphs/Networks) in Apache Spark. With all the recent activity related to the project, I felt it was important to run medium-sized benchmarks to track performance improvements. Unfortunately, the Scala ecosystem is in poor shape regarding benchmarking frameworks. I couldn’t find any viable Scala-native solution, but there’s an actively maintained sbt-jmh plugin. JMH (Java Microbenchmark Harness) has become the de-facto standard for benchmarking unless you are prepared to develop and maintain your own tool.
While the initial setup was straightforward, I encountered several unexpected challenges. For example, determining how and when to configure the Spark Session, deciding on the best way to read and persist datasets to benchmark the library itself (without inadvertently benchmarking Apache Spark readers), and figuring out how to increase driver memory when the application is run via the JVM rather than through spark-submit.
Benchmarks for GraphFrames
Because GraphFrames focuses on graph algorithms, an obvious choice was to use benchmarks from the Linked Data Benchmark Council. Datasets for benchmarking are provided as zipped archives containing CSV files without headers, ground truth results, and properties with configurations for algorithms. In one of the previous PRs, I already added XS-sized checks to the GraphFrames tests. Since I plan to run both tests and benchmarks in CI, and the file sizes are too large to store directly in the Git repository, I created a short utility to download and unpack the files:
def downloadLDBCIfNotExists(path: Path, name: String): Unit = {
  checkName(name)
  val dir = path.resolve(name)
  if (Files.notExists(dir) || (Files.list(dir).count() == 0L)) {
    println(s"LDBC data for the case ${name} not found. Downloading...")
    checkZSTD()
    if (Files.notExists(dir)) {
      Files.createDirectory(dir)
    }
    val archivePath = path.resolve(s"${name}.tar.zst")
    val connection = ldbcURL(name).openConnection()
    val inputStream = connection.getInputStream
    val outputStream = Files.newOutputStream(archivePath)
    val buffer = new Array[Byte](bufferSize)
    var bytesRead = 0
    while ({ bytesRead = inputStream.read(buffer); bytesRead } != -1) {
      outputStream.write(buffer, 0, bytesRead)
    }
    inputStream.close()
    outputStream.close()
    println(s"Uncompressing ${archivePath.toString} to ${dir.toString}...")
    s"zstd -d ${archivePath.toString} -o ${archivePath.toString.replace(".zst", "")}".!
    s"tar -xf ${archivePath.toString.replace(".zst", "")} -C ${dir.toString}".!

    // Clean up
    Files.delete(archivePath)
    Files.delete(Paths.get(archivePath.toString.replace(".zst", "")))
  }
}
Because such an utility should be accessed to both tests and benchmarks, for GraphFrames it is placed under the org.graphframes.examples package and is a part of the core. This is a not so big tradeoff, because it is only one simple object with a couple of functions, no additional dependencies.
Creating a JMH sbt project
Benchmarks settings in build.sbt should follow practices recommended by the maintainers of the sbt-jmh plugin. It is suggested to place benchmark-specific configurations in a separate project to ensure clarity and maintainability. Additionally, this project should be flagged for skipping during the publishing process to avoid unnecessary uploads. Since GraphFrames and its dependencies in Spark are marked as provided (as for the most of spark-related 3d-party libraries), it is important to modify the dependencies’ scope to runtime for benchmark purposes. Assuming your project already includes project-level sbt-settings, a proper benchmarks project setup in sbt may have the following configuration:
lazy val benchmarks = (project in file("benchmarks"))
  .dependsOn(core)
  .settings(
    commonSetting,
    coverageEnabled := false,
    name := "graphframes-benchmarks",
    publish / skip := true,
    publishArtifact := false,
    libraryDependencies ++= Seq(
      // This is required for the Intellij IDEA's JMH plugin.
      "org.openjdk.jmh" % "jmh-generator-annprocess" % jmhVersion,
      // For benchmarks the scope should be runtime
      "org.apache.spark" %% "spark-graphx" % sparkVer % "runtime" cross CrossVersion.for3Use2_13,
      "org.apache.spark" %% "spark-sql" % sparkVer % "runtime" cross CrossVersion.for3Use2_13,
      "org.apache.spark" %% "spark-mllib" % sparkVer % "runtime" cross CrossVersion.for3Use2_13))
  .enablePlugins(JmhPlugin)
Do not forget to add a jmh plugin to your plugins.sbt:
// JMH & benchmarking
addSbtPlugin("pl.project13.scala" % "sbt-jmh" % "0.4.7")
Creating a benchmark
JMH State
JMH provides a way to create a state that may be shared between benchmarks. I used this state to store both the SparkSession and datasets that the benchmark reads from the disk after downloading. One might think that it would be better to use the State annotation from JMH to store the data, but unfortunately, the state is created before the setup runs. So, if one needs to use the Spark session during the generation of the state, using the state for the SparkSession is not an option. I found a workaround that is not Scala-idiomatic, but it works. I used var to declare var graph: GraphFrame = _ (data) and created a SparkSession in the setup, immediately using it to modify the data. Because the SparkSession is a singleton, there is no reason for me to make it a part of the state. However, if one needs it, it can be part of the state in the same way, like var spark: SparkSession = _.
val benchmarkGraphName: String = LDBCUtils.GRAPH500_24
var graph: GraphFrame = _

@Setup(Level.Trial)
def setup(): Unit = {
  val sparkConf = new SparkConf()
    .setMaster("local[*]")
    .setAppName("GraphFramesBenchmarks")
    .set("spark.sql.shuffle.partitions", s"${Runtime.getRuntime.availableProcessors()}")
    .set("spark.serializer", "org.apache.spark.serializer.KryoSerializer")

  val spark = SparkSession.builder().config(sparkConf).getOrCreate()
  val context = spark.sparkContext
  context.setLogLevel("ERROR")

  LDBCUtils.downloadLDBCIfNotExists(resourcesPath, benchmarkGraphName)

  val edges = spark.read
    .format("csv")
    .option("header", "false")
    .schema(StructType(Seq(StructField("src", LongType), StructField("dst", LongType))))
    .load(caseRoot.resolve(s"${benchmarkGraphName}.e").toString)
    .persist(StorageLevel.MEMORY_AND_DISK_SER)
  println()
  println(s"Read edges: ${edges.count()}")

  val vertices = spark.read
    .format("csv")
    .option("header", "false")
    .schema(StructType(Seq(StructField("id", LongType))))
    .load(caseRoot.resolve(s"${benchmarkGraphName}.v").toString)
    .persist(StorageLevel.MEMORY_AND_DISK_SER)
  println(s"Read vertices: ${vertices.count()}")

  graph = GraphFrame(vertices, edges)
}
In my case, working with medium-sized LDBC graphs (~260 million edges), reading this large CSV file using Spark, serializing the data, and storing it in memory takes approximately 10 minutes on my ThinkPad laptop. If downloading is necessary, the process takes even longer. Naturally, I prefer not to benchmark the network, the zstd tool, or the Apache Spark CSV data source, so I found this strategy to be reasonable. Of course, users of GraphFrames will rarely work with persisted and serialized data, so I tried to make this point as clear as possible in the documentation.
Spark’s memory
The first challenge I faced was dealing with OutOfMemory (OOM) errors. By design and documentation, Spark applications should not be executed using an existing JVM, but rather through the spark-submit command. Users must explicitly specify the amount of memory to allocate to the Spark driver and executors. Since I executed the setup in JMH within an already existing JVM, it became impossible to increase the memory allocation for the driver using spark.driver.memory to prevent OOM. In fact, Spark’s documentation even explicitly mentions this limitation.
Note: In client mode, this config must not be set through the SparkConf directly
in your application, because the driver JVM has already started at that point.
Instead, please set this through the --driver-memory command line option or in
your default properties file.
I found a solution in JMH features. To perform proper benchmarking, it allows forking the process and running a “fresh” JVM. What’s crucial in my case is that JMH enables passing Java options to the fork command. Therefore, all I need to do is create a list of options required by Spark itself and include the -Xmx option.
@State(Scope.Benchmark)
@Warmup(iterations = 5)
@Measurement(iterations = 15)
@BenchmarkMode(Array(Mode.AverageTime))
@OutputTimeUnit(TimeUnit.SECONDS)
@Fork(
  value = 1,
  jvmArgs = Array(
    "-Xmx10g",
    "--add-opens=java.base/sun.nio.ch=ALL-UNNAMED",
    "--add-opens=java.base/java.lang=ALL-UNNAMED",
    "--add-opens=java.base/java.nio=ALL-UNNAMED",
    "--add-opens=java.base/java.lang.invoke=ALL-UNNAMED",
    "--add-opens=java.base/java.util=ALL-UNNAMED"))
class LDBCBenchmarkSuite {}
In this case, the benchmark’s JVM will have 10 gigabytes of memory and Spark will split it by its own rules. In my case, 10 Gb of JVM memory transforms to the spark.driver.memory equal to about 5.7 gigabytes.
Benchmarks
Spark’s GraphFrames library includes many widely used algorithms, with ConnectedComponents being one of the most notable. It’s critical to monitor its performance early on. Fortunately, Spark offers a seamless method to enforce the full computation of a Dataset without reinventing the wheel, such as by saving it to a specified path like /tmp/_result123.parquet.
@Benchmark
def benchmarkCC(blackhole: Blackhole): Unit = {
  val ccResults =
    graph.connectedComponents.setUseLocalCheckpoints(true).setAlgorithm("graphframes").run()
  val res: Unit = ccResults.write.format("noop").mode("overwrite").save()
  blackhole.consume(res)
}
Bonus
Integration of benchmarks results to documentation
GraphFrames is historically a Scala-first library. So, it was quite obvious to choose the Scala-native tool for the generation of its documentation. During my work on updating the documentation, I chose Typelevel Laika. Laika supports markdown, but I was hoping to find a way to automatically populate the content with benchmark results during the CI/CD. Fortunately, Laika is fantastically flexible, and one of the features is user-defined variables. Additionally, JMH supports writing output to a JSON file. The workflow should already be obvious: running JMH and storing results in JSON -> reading this JSON and populating Laika’s variables -> using these variables in benchmarks.md to populate the content.
Reading resulted JSON:
def laikaConfig(benchmarksFile: Path): LaikaConfig = {
  val baseConfig = LaikaConfig.defaults // Add here your Laika options

  if (!Files.exists(benchmarksFile)) {
    println(s"File $benchmarksFile does not exist. Skipping.")
    return baseConfig
  }
  Using(scala.io.Source.fromFile(benchmarksFile.toFile)) { source =>
    {
      parse(source.mkString)
        .getOrElse(Json.Null)
        .asArray // JMH JSON file is an array of benchmarks
        .map(array =>
          array.foldLeft(baseConfig) { (config, bench) =>
            {
              // Name of the benchmarks in the JSON is a full package + name of the method
              // I need only the last one.
              val name =
                bench.hcursor.downField("benchmark").as[String].getOrElse("").split("\\.").last
              // That is an amount of iterations
              val measurements =
                bench.hcursor.downField("measurementIterations").as[Int].getOrElse(-1)
              // That is an average time
              val metric = bench.hcursor
                .downField("primaryMetric")
                .downField("score")
                .as[Double]
                .getOrElse(0.0)
              // That is an array of two elements:
              // left and right borders of the 99.9% confidence interval
              val stdErr = bench.hcursor
                .downField("primaryMetric")
                .downField("scoreError")
                .as[Double]
                .getOrElse(0.0)

              config
                .withConfigValue(s"benchmarks.$name.metric", f"$metric%.4f")
                .withConfigValue(s"benchmarks.$name.measurements", measurements)
                .withConfigValue(
                  s"benchmarks.$name.ciLeft",
                  f"${Try(confidence(0)).getOrElse(0.0)}%.4f")
                .withConfigValue(
                  s"benchmarks.$name.ciRight",
                  f"${Try(confidence(1)).getOrElse(0.0)}%.4f")
                .withConfigValue(s"benchmarks.$name.stdErr", f"$stdErr%.4f")
            }
          }
        )
      }.toOption.flatten.getOrElse(baseConfig)
  }
Do not forget to add dependencies for parsing of the JSON to your plugins.sbt:
// JSONs processing for benchmarks
val circeVersion = "0.13.0"

libraryDependencies ++= Seq(
  "io.circe" %% "circe-core",
  "io.circe" %% "circe-generic",
  "io.circe" %% "circe-parser"
).map(_ % circeVersion)
And the content of the benchmarks.md may look like this:
| Algorithm            | Measurements                           | Time (s)                         | Error (s)                        | Confidence Interval (99.9%)                                             |
|----------------------|----------------------------------------|----------------------------------|----------------------------------|-------------------------------------------------------------------------|
| Shortest Paths       | ${benchmarks.benchmarkSP.measurements} | ${benchmarks.benchmarkSP.metric} | ${benchmarks.benchmarkSP.stdErr} | [${benchmarks.benchmarkSP.ciLeft}, ${benchmarks.benchmarkSP.ciRight}\\] |
| Connected Components | ${benchmarks.benchmarkCC.measurements} | ${benchmarks.benchmarkCC.metric} | ${benchmarks.benchmarkCC.stdErr} | [${benchmarks.benchmarkCC.ciLeft}, ${benchmarks.benchmarkCC.ciRight}\\] |
That is rendered to something like this:
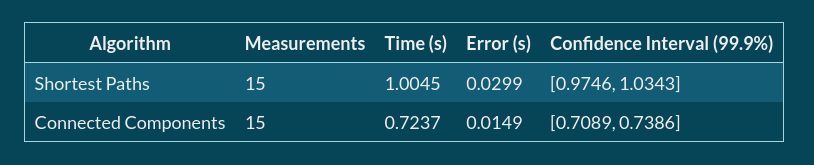
P.S.
Computing connected components or single-source shortest paths for a graph of 8 millions of vertices and 260 millions of edges looks no so bad at all, doesn’t it?